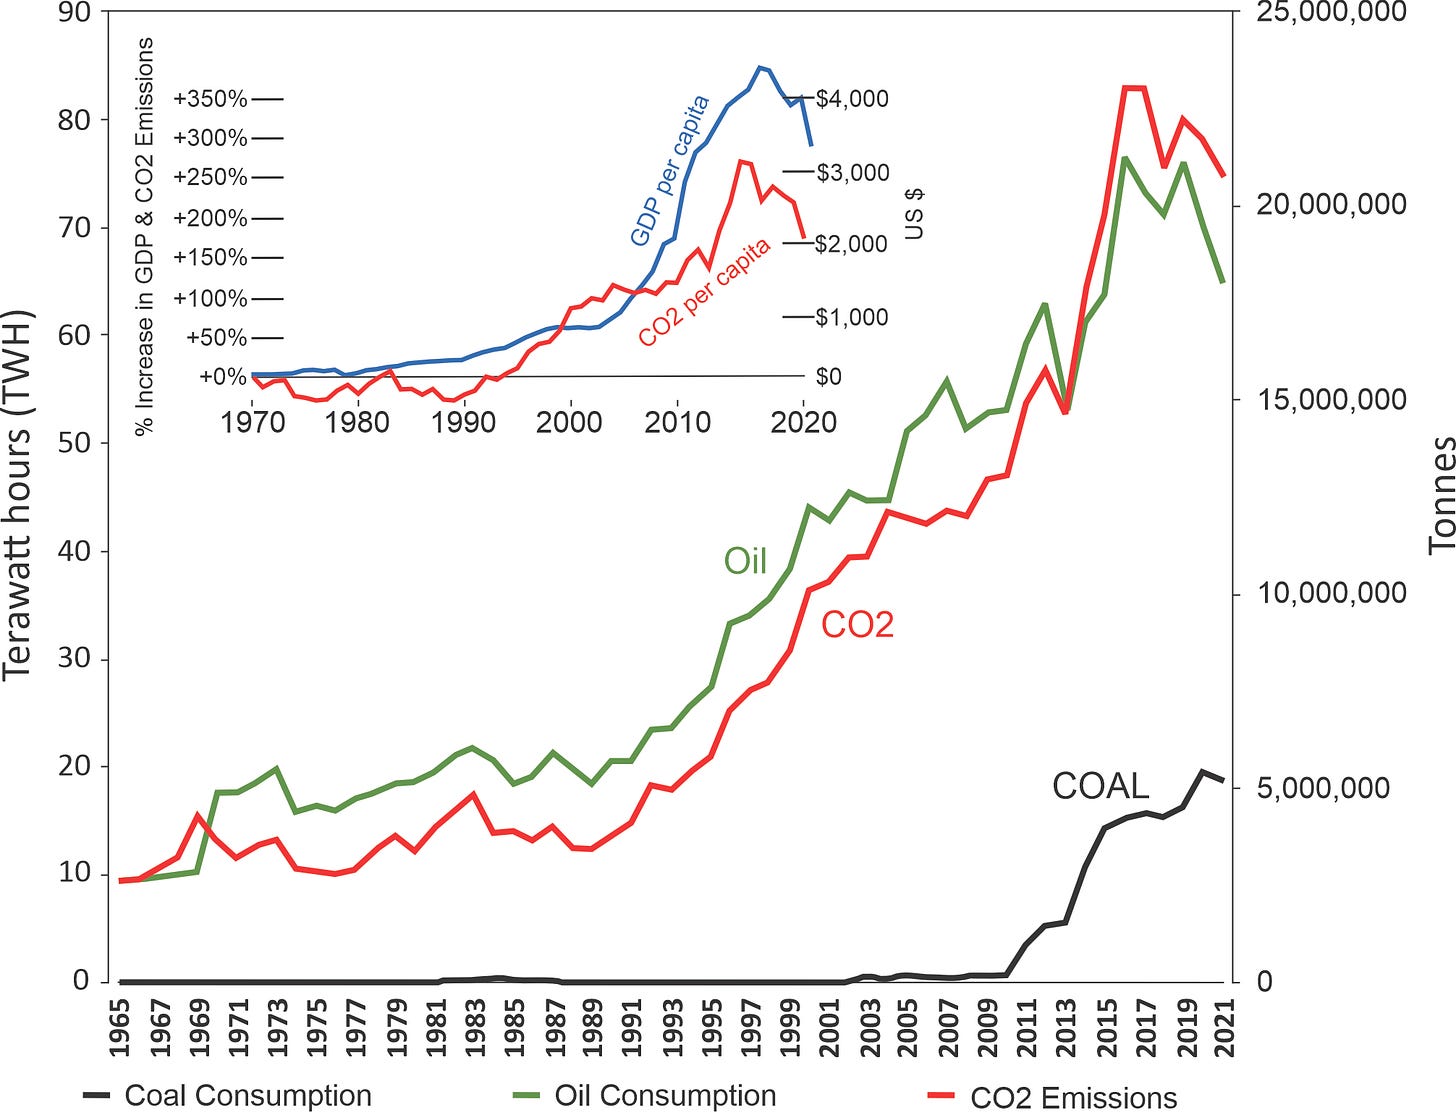
Less oil, less CO2 emissions, less economy, Sri Lanka
one way to get to less emissions but not the best
Sri Lanka has reduced its oil consumption and CO2 emissions since 2019, but this shouldn't be seen as a good or voluntary move. Rather, it's the result of a deep crisis where the economy shrank by 7.9 percent in the first half of 2023, 7.8 percent in 2022, and until very recently has been on a general downward trend since 2018 (World Bank, 2023). Since 2019, the number of its poor have increased from 4 to 7 million, now 31% of the population (LirneAsia Survey, 2023). According to the World Food Program, Sri Lanka has levels of acute malnutrition – ranging between 14 and 35 percent in the districts they surveyed.
Large graph shows Sri Lanka’s fossil fuel energy consumption (TWH) and CO2 emissions from 1970 to 2022 (Our World in Data, 2023, Macrotrends, 2023). Sri Lanka’s emissions, while tiny, have accelerated since 1990 with increasing oil use and further with increased coal use since 2010. Smaller graph shows per capita %, and USD, changes in GDP and CO2 emissions from 1970 to 2022 and illustrates the strong correlation between economic growth or contraction and emission increases or reductions, respectively.
Sri Lanka submitted its instrument of ratification to the Paris Agreement at the UN General Assembly in New York on 21 September 2016, despite having emitted very little CO2 annually, 38.4 million tonnes in 2021, and cumulatively, 534 million tonnes from 1800-2022. For comparison, China emitted 10.3 billion tonnes in 2021 and cumulatively 261 billion tonnes from 1800-2022, while the USA emitted 5.6 billion tonnes in 2021, and cumulatively 427 billion tonnes from 1800-2022.
LirneAsia Survey, https://lirneasia.net/
Our World in Data, 2023, https://lnkd.in/g7yh2aKf
Macrotrends, 2023, Sri Lanka GDP 1970-2023, https://lnkd.in/gpAqXwne
World Bank, 2023, Sri Lanka Development Update 2023, Publication October 3, 2023, https://lnkd.in/g9U84cAE


